
Hemolysis Sample Rejection: Practical Thresholds for Labs

Use analyte-specific H-index thresholds to decide when hemolysis sample rejection is warranted, and reserve blanket suppression for cases where interference genuinely exceeds clinically defensible limits. The short rule: reject when the measured free hemoglobin crosses a validated, analyte-specific cutoff AND recollection is feasible and safe. Report with a clear hemolysis comment when the clinical situation is urgent or recollection would delay care. For high-risk analytes like potassium, contact the clinician immediately rather than suppressing the result silently.
Immediate actions when a hemolyzed specimen arrives:
- Flag the result in your LIS with the recorded H-index value and timestamp.
- Contact the ordering clinician directly for any critical or time-sensitive analyte.
- Request recollection only when the patient’s condition allows and the delay poses no additional risk.
- Document the decision, the H-index, and any clinician communication in the audit trail.
Pro Tip: In emergency settings, a clearly worded hemolysis comment attached to the result is almost always safer than automatic suppression. Clinicians can act on an imperfect result; they cannot act on one they never receive.
Key Takeaways
Analyte-specific, concentration-dependent H-index thresholds are the most effective single change a lab can make to reduce unnecessary hemolysis sample rejection while maintaining diagnostic safety.
| Point | Details |
|---|---|
| Use analyte-specific thresholds | Concentration-dependent H-index rules cut rejection rates from 14.4% to 3.1% in documented studies. |
| Never suppress without communication | Automatic suppression of hemolyzed potassium results has caused delayed therapy; always notify the clinician. |
| Validate locally, not from package inserts | Manufacturer cutoffs are conservative; run interference studies against your own analyzer and TAE targets. |
| Automate with middleware | Instrument Manager enables tiered, analyte-aware rules with full audit logging required for ISO 15189. |
| Kohealth Labs for multisite trials | Kohealth Labs provides centralized SOPs, cross-site H-index validation, and AI monitoring to keep rejection rates consistent across all study sites. |
What is hemolysis and why does it cause sample rejection?
Hemolysis is the rupture of red blood cells and the release of their intracellular contents into the surrounding plasma or serum. It is the single most common cause of specimen unsuitability in clinical laboratories. Research shows that in vitro hemolysis accounts for the large majority of unsuitable specimens, while true in vivo hemolysis represents under 2% of hemolyzed samples. That distinction matters for policy: a sample that looks hemolyzed because of a traumatic draw is a collection problem, not a patient problem, and should be handled differently from a sample that is hemolyzed because the patient has an active hemolytic anemia.
In vivo vs. in vitro hemolysis
In vivo hemolysis originates inside the patient from conditions such as autoimmune hemolytic anemia, transfusion reactions, or mechanical heart valves. Suspected in vivo hemolysis requires clinical correlation, haptoglobin and reticulocyte workup, and sometimes a peripheral smear review before any rejection decision. Rejecting that specimen as a routine quality failure misses the diagnosis entirely.
In vitro hemolysis is a pre-analytical artifact from collection, transport, or processing. It is preventable, and it is where most lab policy effort belongs.
Three mechanisms of interference
The consensus statement on hemolyzed specimen management identifies three distinct interference pathways:
- Spectral interference: Free hemoglobin absorbs light at wavelengths used by photometric assays, directly distorting absorbance readings. Direct bilirubin and some immunoassays are particularly vulnerable.
- Additive/leakage effects: Intracellular components flood the sample. Potassium, LDH, AST, phosphate, and folate are all present at concentrations many times higher inside erythrocytes than in plasma, so even modest hemolysis produces measurable elevation.
- Chemical/enzymatic interference: Free hemoglobin or its breakdown products alter reaction kinetics in specific assays, producing non-linear or unpredictable errors.
Potassium is the archetypal affected analyte because its intracellular concentration is roughly 25 times its plasma concentration. A small degree of hemolysis produces a clinically significant spurious elevation. ISO 15189 expects laboratories to document which tests are affected, at what H-index levels, and what action is taken at each threshold.
Which analytes are most affected by hemolysis in blood samples?
Not all tests respond to hemolysis the same way, and your rejection policy should reflect that. The following priority list covers the analytes most commonly affected, with the expected direction of bias.
Analytes with additive/leakage elevation (false increase):
- Potassium (K+): Highest clinical risk. Even mild hemolysis (H-index ~20–50 mg/dL free Hb) can push a normal result into the hyperkalemic range. Recollection or urgent clinician communication is usually required.
- Lactate dehydrogenase (LDH): Extremely sensitive. Erythrocyte LDH is 150–200 times the plasma concentration; any visible hemolysis renders the result unreliable for most clinical decisions.
- Aspartate aminotransferase (AST): Falsely elevated. Moderate hemolysis can mimic hepatocellular injury.
- Phosphate: Elevated by intracellular leakage; clinically significant at moderate H-index levels.
- Folate: Erythrocyte folate is far higher than serum folate; hemolysis produces false elevation.
- Creatine kinase (CK): Elevated, though less dramatically than LDH.
- Iron: Falsely elevated by intracellular iron release.
- Magnesium: Mild elevation; usually tolerable at low H-index levels with a comment.
Analytes with spectral or suppression effects:
- Direct bilirubin: Spectral interference from oxyhemoglobin causes false suppression at lower H-index levels and false elevation at higher ones. Non-linear behavior makes this analyte particularly difficult to report with confidence when hemolysis is present.
- High-sensitivity cardiac troponin (hs-cTn): Some platforms show interference at elevated free Hb; the direction and magnitude are platform-specific. Always check your manufacturer’s package insert.
Analytes that often tolerate reporting with a comment:
Some chemistry panels (e.g., sodium, chloride, creatinine, glucose) show minimal interference at low-to-moderate H-index levels. These can often be reported with a hemolysis comment rather than suppressed, provided the H-index is documented and the clinician is informed. Hemolysis-sensitive serologies, by contrast, typically require recollection when free hemoglobin exceeds roughly 100 mg/dL, because matrix effects compromise immunoassay binding.
How do labs detect and measure hemolysis objectively?
H-index and automated spectrophotometry
The H-index (also called the HIL index when combined with icterus and lipemia) is a spectrophotometric measurement of free hemoglobin in serum or plasma, expressed in approximate mg/dL equivalents. Modern chemistry analyzers measure absorbance at specific wavelengths before running the sample panel, then assign a numeric H-index that maps to a free-hemoglobin concentration. The Roche Cobas c702, for example, performs serum index measurements as part of its standard pre-analytical workflow, allowing the H-index to be captured automatically and passed to the LIS before any result is released.
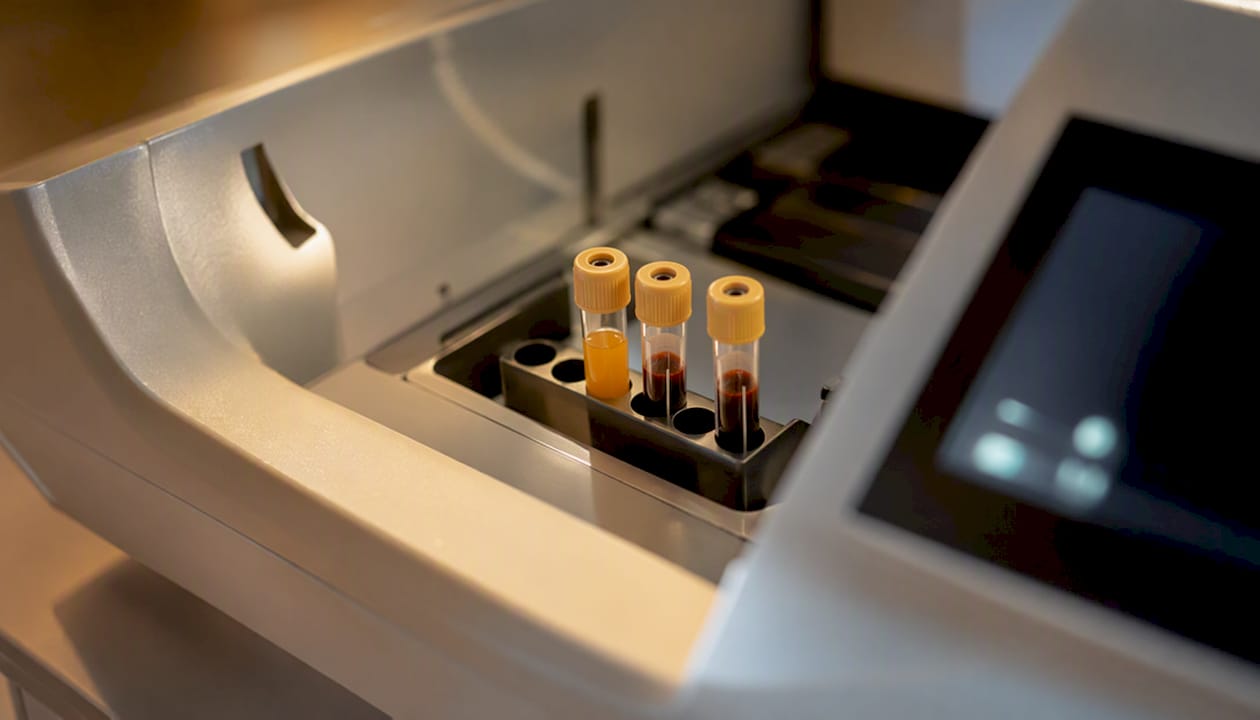
Automated spectrophotometry is more reproducible than visual inspection, less subject to observer fatigue, and produces a numeric value that can be used directly in middleware rules. The CDC Hemolysis Reference Palette provides a standardized visual tool for qualitative assessment, which is useful for training and for settings without automated index capability, but spectrophotometric H-index measurement should be the standard where available.
Limitations to document in your validation records
- Matrix differences: H-index calibration may differ between serum and plasma; validate separately if your lab uses both.
- Analyzer-specific scaling: H-index numeric values are not interchangeable across platforms. An H-index of 100 on one analyzer may not equal 100 mg/dL free Hb on another.
- Inter-individual erythrocyte variability: Hemoglobin content per cell varies by patient, affecting the relationship between H-index and actual interference magnitude.
- Transport effects: Pneumatic tube systems can cause mechanical hemolysis; validate H-index behavior for samples transported via PTS.
Document your instrumentation, calibration approach, and H-index-to-free-Hb mapping in your validation records to satisfy ISO 15189 expectations for pre-analytical quality management.
How should labs set hemolysis rejection criteria and policies?
Manufacturer cutoffs vs. concentration-dependent thresholds
Manufacturer package-insert cutoffs are conservative by design. They are set to protect the assay across the widest possible population and matrix range, which means they often flag samples as unsuitable when the actual interference at that analyte concentration is clinically insignificant. A lab that applies package-insert cutoffs uniformly will reject far more samples than necessary.
Concentration-dependent, analyte-specific H-index thresholds offer a better approach. One institution significantly lowered combined rejection rates for three sensitive assays (AST, LDH, and direct bilirubin) after implementing tailored thresholds and interpretive comments. The key is that the threshold is set based on the actual analyte concentration in the sample and the total allowable error (TAE) for that test, not a single universal cutoff.
Policy checklist for ISO 15189 alignment
- Define which analytes require hemolysis rules and document the clinical rationale.
- Establish tiered H-index thresholds per analyte, based on interference studies and TAE.
- Create LIS flags that trigger automatically when the H-index exceeds each threshold.
- Write clinician-consult rules: who is contacted, when, and how the communication is documented.
- Record the scientific rationale for each threshold in your SOP, with reference to validation data.
- Review and update thresholds annually or when the analyzer platform changes.
Middleware platforms such as Instrument Manager (Data Innovations) are the practical implementation path for these rules. Instrument Manager can receive the H-index from the analyzer, compare it against analyte-specific thresholds, and automatically append a comment, suppress a result, or escalate to a technologist, all with a full audit trail.
Example tiered threshold framework
| Analyte | Manufacturer H-index cutoff (approx.) | Lab tier 1 (report + comment) | Lab tier 2 (recollect) |
|---|---|---|---|
| Potassium | H ≥ 20 | H 10–30 (low analyte conc.) | H > 30 or critical range |
| LDH | H ≥ 20 | H 10–25 (low clinical urgency) | H > 25 |
| AST | H ≥ 50 | H 30 mg/dL (low baseline) | H-index above validated tier-2 threshold |
| Direct bilirubin | H ≥ 20 | Not recommended | H ≥ 20 |
| Sodium/creatinine | H ≥ 200 | H 50–200 + comment | H > 200 |
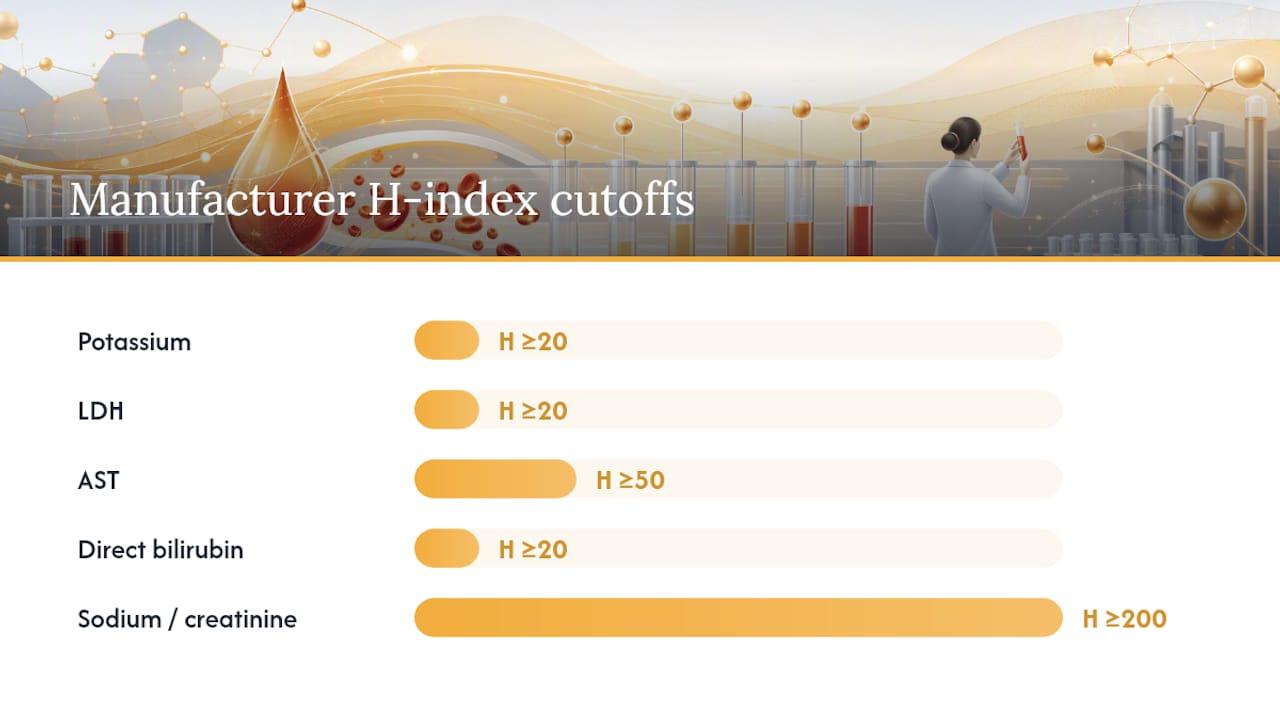
Note: These values are illustrative. Your lab must validate thresholds against your own analyzer, patient population, and TAE targets.
When should you report with a comment vs. suppress or recollect?
The documented case of a suppressed hemolyzed potassium result that delayed appropriate therapy is the clearest argument against automatic suppression. The patient’s hypokalemia was masked because the laboratory suppressed the result without contacting the clinician. That outcome is avoidable with a simple two-step policy: report with a hemolysis comment, then call.
Decision factors for each action:
- Report with comment: Analyte is moderately affected, clinical urgency is high, recollection would delay care, or the H-index falls in the low-to-moderate tier where interference is unlikely to change clinical management.
- Recollect: Analyte is highly sensitive (potassium, LDH), H-index is above the validated tier-2 threshold, patient condition allows a delay, and the draw error is correctable.
- Suppress (withhold): Reserved for cases where the result is so unreliable that reporting it would cause direct harm, AND the clinician has been notified and agrees. This should be the least common action.
- Treat as in vivo: Repeat hemolysis on multiple draws, clinical history of hemolytic condition, or haptoglobin/reticulocyte data supporting active hemolysis. Do not reject; investigate.
Clinician communication script for urgent hemolyzed results:
Pro Tip: Document every clinician communication in the LIS, including the time, the name of the person contacted, and the agreed action. This record is required for ISO 15189 audits and protects both the lab and the clinical team.
How do you design and validate lab-specific hemolysis thresholds?
Step-by-step interference study protocol
- Select analytes. Prioritize those with known intracellular leakage or spectral sensitivity: potassium, LDH, AST, direct bilirubin, phosphate, folate, CK, and any platform-specific analytes flagged by your manufacturer.
- Source donor blood. Collect fresh whole blood from healthy donors. Prepare a hemolysate by freeze-thaw cycling or mechanical lysis, then dilute to a range of free-hemoglobin concentrations (e.g., 0, 50, 100, 200, 500, 1000 mg/dL).
- Prepare sample pools. Create low, medium, and high analyte concentration pools for each test. This is critical because interference is often concentration-dependent: a 10% bias at a low potassium concentration has different clinical significance than the same bias at a high concentration.
- Run interferographs. Add hemolysate titrations to each pool and measure the analyte at each H-index level. Run in triplicate to capture within-run variability.
- Calculate percent bias. For each H-index level and analyte concentration, calculate: % bias = [(hemolyzed result − baseline result) / baseline result] × 100.
- Apply TAE and clinical decision limits. Compare percent bias against your lab’s TAE for each analyte and against clinical decision limits (e.g., the potassium critical value range). The H-index at which bias first exceeds TAE is your candidate threshold.
- Model the relationship. Plot percent bias vs. H-index. Use linear regression for analytes with proportional interference; use non-linear modeling for analytes like direct bilirubin where the relationship is not monotonic.
- Cross-validate with patient samples. Pull a set of real patient samples with known H-index values and compare predicted vs. observed bias. Adjust thresholds if needed.
Validation data capture template
Validation checklist
- Cross-check thresholds against at least 20 real patient samples spanning the H-index range.
- Document the SOP with version control and approval signatures.
- Map validated thresholds directly to LIS/middleware rules in Instrument Manager.
- Retain all raw data, interferographs, and statistical outputs for ISO 15189 audits.
- Schedule re-validation when the analyzer platform, reagent lot, or assay method changes.
How do you prevent hemolysis at collection, transport, and processing?
Prevention is where you get the most return. Phlebotomy technique and device selection are the primary drivers of in vitro hemolysis, and targeted training consistently produces the largest reductions in rejection rates.
Collection checklist
- Select a vein with adequate caliber; avoid fragile or sclerosed veins when possible.
- Use an appropriate needle gauge: 21–23G for most adults. Smaller gauges increase turbulence and mechanical lysis.
- Never draw through an IV line unless no alternative exists, and always discard the first 5 mL if you do.
- Keep tourniquet time under one minute. Prolonged stasis causes cellular stress and potassium leakage before the draw even begins.
- Allow the alcohol prep to dry completely before puncture. Residual alcohol lyses cells.
- Follow the correct order of draw to prevent cross-contamination between tube additives.
- Mix tubes by gentle inversion (5–8 times); never shake.
Transport and processing controls
- Avoid excessive agitation during transport. Pneumatic tube systems (PTS) are a known hemolysis source; cushion specimens and validate your PTS settings.
- Centrifuge promptly: serum tubes within 30 minutes of clotting, EDTA plasma within 60 minutes of collection.
- Maintain correct fill volume. Under-filled tubes alter the blood-to-additive ratio and increase cell fragility.
- Separate plasma or serum from cells promptly after centrifugation, especially for potassium.
For catheter-drawn samples in the ED or ICU, switching to manual-aspiration blood collection systems can reduce hemolysis rejection rates dramatically. Studies have shown a marked reduction in hemolysis rejection rates in catheter-draw settings when manual-aspiration systems replace vacuum tubes.
Pro Tip: When using a syringe, avoid forceful aspiration and never expel blood rapidly through the needle into the tube. Shear stress from rapid expulsion is a leading cause of mechanical hemolysis in syringe-drawn samples. Transfer slowly, or use a transfer device that removes the needle first.
Training program components
- Hands-on venipuncture competency assessment at hire and annually thereafter.
- Targeted retraining for staff in high-rejection areas (ED, ICU, pediatrics).
- Feedback loops: share unit-level rejection rates with phlebotomy teams monthly.
- Periodic audits of technique using direct observation or video review.
- Reference lab best practices for supply handling to complement venipuncture training with proper tube and reagent management.
How do you configure automated hemolysis detection and middleware rules?
Automated HIL detection, combined with middleware-driven autoverification, removes human inconsistency from hemolysis handling and creates an auditable record for every decision. Instrument Manager (Data Innovations) is the most widely deployed middleware platform for this purpose in U.S. clinical laboratories.
Implementation steps
- Instrument H-index capture: Confirm the analyzer (e.g., Roche Cobas c702) is configured to transmit the H-index value to the LIS with every result set.
- LIS mapping: Map the H-index field to a discrete LIS result field, not a comment string. Discrete fields allow middleware rules to compare numeric values.
- Instrument Manager rule configuration: Build analyte-specific rules that evaluate the H-index against your validated tiered thresholds. Example rule logic: IF analyte = potassium AND H-index > 30 THEN suppress result AND append comment AND escalate to tech. IF analyte = sodium AND H-index < 200 THEN append hemolysis comment AND release.
- Audit logging: Configure Instrument Manager to store the H-index value, the rule triggered, the action taken, the timestamp, and the user who reviewed any manual override.
Exception handling and escalation
- Define an override policy: which staff levels can release a suppressed result, and what documentation is required.
- Create an emergency clinician-initiated reporting pathway: a clinician can request release of a suppressed result with a documented verbal order, which is then logged in the LIS.
- Escalation pathways should route to a senior technologist or pathologist for any case where the H-index exceeds the tier-2 threshold and recollection is not feasible.
Common implementation pitfalls
- Mis-mapped units: H-index values from different analyzers may use different numeric scales. Verify that the value transmitted to Instrument Manager matches the units used in your threshold rules.
- Analyzer-specific H-index scaling: Never copy threshold values from a published study without confirming they apply to your specific analyzer and calibration.
- For a structured approach to auditing your middleware configuration, a step-by-step lab audit guide provides a useful framework for ISO 15189 preparation.
What QA metrics should you track to reduce hemolysis rejection rates?
Tracking the right metrics turns hemolysis management from a reactive problem into a controlled process. The goal is not zero hemolysis; it is a defensible, stable rejection rate with a clear improvement trajectory.
Key metrics to monitor
- Overall hemolysis rejection rate: Total hemolyzed rejections divided by total specimens received. Baseline this before any intervention.
- Analyte-specific rejection rate: Track potassium, LDH, and direct bilirubin separately, since these drive most clinical impact.
- Repeat-rejection rate per patient: Flags patients with recurrent hemolysis, which may indicate in vivo hemolysis or a persistent collection problem.
- ED vs. outpatient rates: ED rates are typically higher; separate tracking allows targeted intervention.
- Time-to-recollection: How long after a rejection does a new sample arrive? Long delays signal a communication or workflow problem.
- Clinical-impact incidents: Any case where a hemolysis-related rejection or suppression contributed to a delayed or incorrect clinical decision.
Realistic targets and evidence-based interventions
Concentration-dependent thresholds alone can reduce rejection rates from 14.4% to 3.1% for sensitive assays. Phlebotomy training programs, when combined with feedback loops and device changes, produce additional reductions, particularly in the ED. Use PDSA (Plan-Do-Study-Act) cycles to test one intervention at a time and run control charts to distinguish real improvement from random variation.
Statistic to cite in leadership reports: One institution reduced combined hemolysis rejection from 14.4% to 3.1% for three sensitive assays after implementing analyte-specific thresholds and interpretive comments, without compromising diagnostic safety.
Report QA results to clinical leadership quarterly, share unit-level data with phlebotomy supervisors monthly, and include hemolysis rejection rates in your ISO 15189 management review documentation. For broader pre-analytical quality context, biomarker analytics in patient care covers how pre-analytical errors affect downstream diagnostic decisions.
How integrated diagnostics reduce hemolysis rejection in multisite trials
Multisite clinical trials face a compounded version of the hemolysis problem. Each site has its own phlebotomy staff, analyzers, and LIS configurations, which means rejection rates, H-index scales, and reporting rules can vary widely across a single protocol. That variability translates directly into missing data points, protocol deviations, and delayed enrollment.
An integrated diagnostics model addresses this at the system level:
- Centralized phlebotomy SOPs: A single, protocol-specific collection SOP distributed to all sites reduces technique variability and sets consistent tube handling and transport standards.
- Vendor-agnostic H-index validation: Cross-site validation studies confirm that H-index thresholds are calibrated equivalently across different analyzer platforms, so a rejection decision at Site A means the same thing as one at Site B.
- Middleware-driven autoverification: Instrument Manager rules configured centrally and deployed consistently across sites eliminate site-specific interpretation differences and create a unified audit trail.
- AI monitoring for anomalous rejection spikes: Automated monitoring of rejection-rate trends across sites can flag a sudden increase at one location, triggering a rapid root-cause investigation before the spike affects trial data completeness.
- Integrated lab and radiology data: When laboratory results and imaging data are bundled in a single analysis-ready dataset, hemolysis flags are visible alongside the full clinical picture, supporting faster and more confident trial decisions. Integrated diagnostics reduce the coordination burden that typically delays data review.
The practical benefits are measurable: fewer repeat draws, lower per-patient data-gap rates, faster database lock, and ISO 15189-aligned documentation that satisfies regulatory review. Reducing protocol deviations in multisite studies depends heavily on pre-analytical consistency, and hemolysis control is one of the highest-leverage points.
The real cost of rigid rejection dogma
The laboratory field has spent decades building quality systems around specimen rejection, and for good reason. A result that is wrong is worse than no result at all, in most situations. But the evidence now points clearly to a more nuanced position: blanket suppression of hemolyzed results, applied without analyte-specific thresholds or clinician communication, creates its own category of patient harm.
The documented case of delayed therapy from suppressed potassium is not an outlier. It is a predictable consequence of a policy that treats all hemolyzed samples as equally unreliable. Potassium at an H-index of 15 in a patient with a normal baseline is a different clinical situation from potassium at an H-index of 150 in a patient with no prior results. A policy that handles both identically is not protecting patients; it is protecting the lab from having to make a judgment call.
The practical answer is local validation, analyte-specific thresholds, and a communication culture where the lab and the clinical team treat hemolysis as shared information rather than a unilateral laboratory decision. ISO 15189 provides the documentation framework. Middleware provides the automation. Training provides the consistency. What ties it together is the willingness to build a policy that is specific enough to be defensible and flexible enough to serve the patient in front of you.
Kohealth Labs supports lower rejection rates across multisite studies
Hemolysis-related rejections cost clinical trials time, data completeness, and patient comfort. Kohealth Labs offers integrated laboratory and radiology diagnostics specifically built for CROs, pharmaceutical sponsors, and government agencies that need consistent, analysis-ready data across multiple sites.

The Kohealth Labs model combines phlebotomy onboarding and training, middleware and LIS integration support, and AI-driven data quality monitoring that flags anomalous rejection patterns before they affect your trial timeline. A single contract covers lab and imaging data, reducing the vendor coordination that typically delays database lock. Centralized SOPs and cross-site H-index validation mean your rejection criteria are consistent from Site 1 to Site 50.
For CROs and sponsors managing complex multisite protocols, explore Kohealth Labs’ integrated clinical diagnostics to see how the platform supports faster enrollment, fewer repeat draws, and ISO 15189-aligned documentation. Contact the team to discuss your protocol’s specific pre-analytical requirements.
Sources
These are the primary references to cite in your SOPs, accreditation materials, and leadership presentations:
- Hemolyzed Specimens: Major Challenge for Identifying and Rejecting Specimens in Clinical Laboratories - PMC
- Can we use smarter hemolysis thresholds to reduce sample rejection rates? - myADLM
- Quick reference tool for hemolysis status - CDC
- PubMed - 38300631
This article is general information, not a substitute for advice from a qualified doctor. Consult a qualified healthcare professional about your own circumstances before acting on anything here.